This indicator examines trends related to home air conditioning and heating by tracking the amount of electricity used by U.S. homes in the summer and energy used in the winter.
![]()
Figure 1. Summer Electricity Use and Cooling Degree Days
![]()
Figure 2. Winter Natural Gas Use and Heating Degree Days
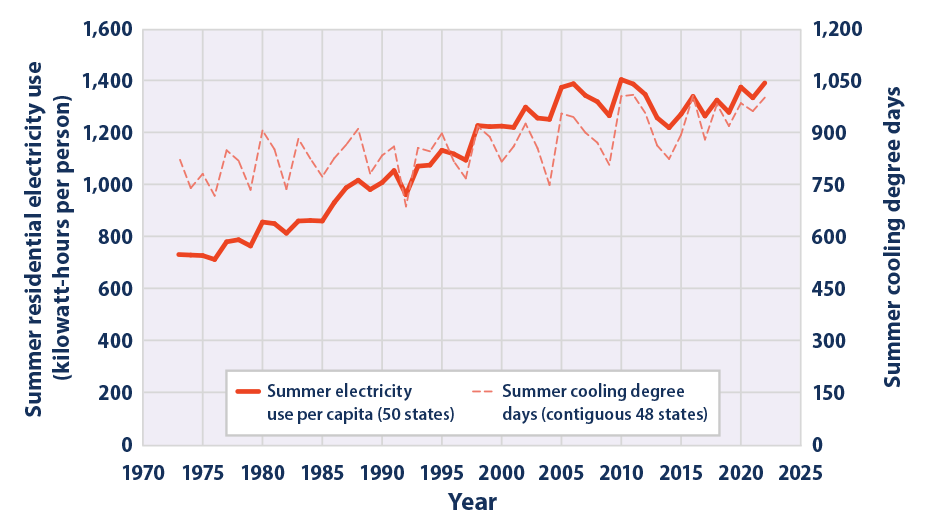
Figure 1. Residential Summer Electricity Use per Capita and Summer Cooling Degree Days in the United States, 1973–2022
This graph shows the amount of electricity used by the average American during the summer months (June, July, and August) of each year from 1973 to 2022. The solid line shows average summer electricity use per capita, and it represents all 50 states plus D.C. For reference, the dashed line shows the average number of cooling degree days for the same months across the contiguous 48 states plus D.C.
Data sources: EIA, 2022 4 ; BEA, 2022 5 ; NOAA, 2022 6
Web update: September 2023
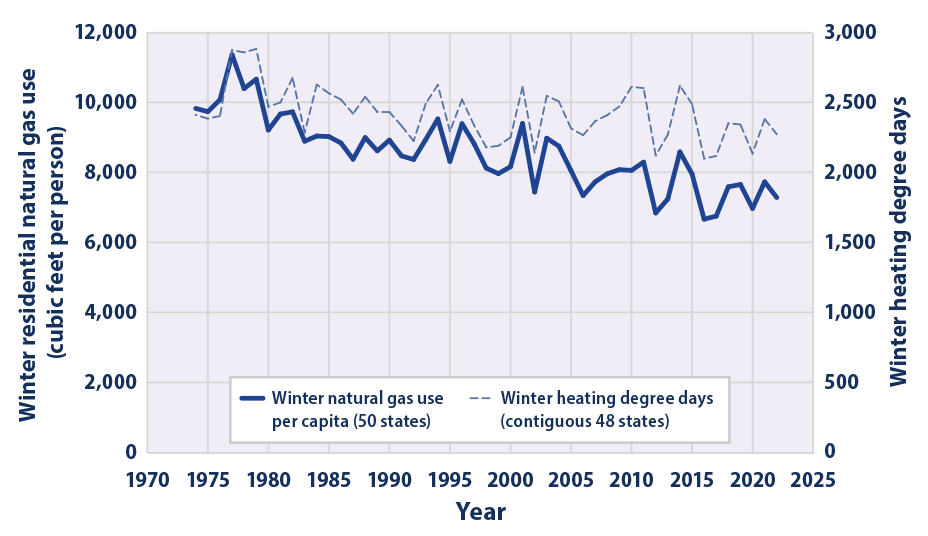
Figure 2. Residential Winter Natural Gas Use per Capita and Winter Heating Degree Days in the United States, 1974–2022
This graph shows the amount of natural gas used by the average American during the winter months (December, January, and February) of each year from 1974 to 2022 (winter “1974” covers December 1973 through February 1974, and so on). The solid line shows average winter natural gas use per capita, and it represents all 50 states plus D.C. For reference, the dashed line shows the average number of heating degree days for the same months across the contiguous 48 states plus D.C.
Data sources: EIA, 2022 7 ; BEA, 2022 5 ; NOAA, 2022 6
Web update: September 2023
Hot weather can be uncomfortable, and in extreme cases dangerous (see the Heat Waves indicator). One way people respond to hot weather is by using air conditioning. Air conditioning is the primary way to cool a home and has become more widely used over time; as of 2015, it accounted for 17 percent of the electricity that the average American household uses every year. 1 Conversely, cold weather requires people to use energy to heat their homes, using electricity and fuels such as natural gas, propane, and oil.
As climate change contributes to an increase in average temperatures and unusually hot days, Americans are expected to use more energy—mostly electricity for air conditioning. 2 As a result, people will likely have to spend more money on electricity for cooling. 2 Increased use of air conditioning could also lead to more greenhouse gas emissions and further climate change, because more electricity must be generated to meet this increased demand. As of 2021, about three-fifths of the electricity in the United States was generated by burning fossil fuels such as coal or natural gas. 3 Burning fossil fuels for electricity is one of the largest sources of heat-trapping greenhouse gas emissions in the United States (see the U.S. Greenhouse Gas Emissions indicator).
The opposite effect could take place with winter heating. As temperatures rise, Americans are expected to use less fuel energy for heating their homes. 2 Overall, though, summer increases in energy use are expected to outweigh any reduction due to lower heating needs in the winter. 2 Improvements in energy efficiency, particularly for electricity-based heating and cooling, can influence residential consumption and demand for energy over time.
This indicator measures changes in residential seasonal energy use in the United States. It has two components:
The data come from the U.S. Energy Information Administration (EIA), which collects comprehensive information about power generation, delivery, and sales from electric power utilities across the country. EIA has collected these data consistently since 1973. For this indicator, EPA divided total residential electricity sales for the summer months by the corresponding total U.S. population to calculate summer electricity use per capita, which Figure 1 shows in kilowatt-hours per person. EPA used a similar method with winter residential natural gas sales, which Figure 2 shows in cubic feet per person.
For reference, Figure 1 also shows summer cooling degree days for each year, while Figure 2 shows winter heating degree days for each year (see the Heating and Cooling Degree Days indicator). In general, more cooling degree days and fewer heating degree days means a combination of more warm days and warmer temperatures on those days. Residential electricity and natural gas use cover all 50 states plus Washington D.C., while cooling and heating degree days are shown for the contiguous 48 states plus D.C., as they are not routinely calculated for Alaska and Hawaii.
This indicator is based on residential retail electricity and natural gas sales. In the case of electricity, sales are not exactly the same as total residential electricity use, because sales data do not count electricity that people generate and consume onsite—for example, using rooftop solar panels. For context, residential solar generated an estimated 33,600 gigawatt-hours of electricity in 2021, which translates to 2.3 percent of total residential retail sales. 8 As more people produce their own power and buy less electricity from a utility, sales data could increasingly underestimate the actual amount of electricity used. However, retail sales data are still the best available approximation for energy use nationwide .
Outdoor air temperature is not the only weather-related factor that influences energy use (humidity and dew point also matter, for example), but it is still a major driver of the amount of electricity and natural gas people use in their homes. That said, rising temperatures are not the only reason why people might use more electricity in the summer and less natural gas in the winter.
One possible factor affecting electricity and natural gas use is where people live. Over the past several decades, the fastest-growing parts of the United States have been in the South and West, which means a growing share of the U.S. population lives in warmer places. The “cooling degree days” line in Figure 1 and the “heating degree days” line in Figure 2 adjust for where people lived as of the 2010 census but do not adjust for changes in population distribution over time.
Other factors include characteristics of people’s homes and the air conditioning and heating equipment they use. As of 2020, 88 percent of U.S. homes use some type of air conditioning, and 66 percent have central air conditioning installed. 9 These numbers have increased over time, as has the size of the average American home, which means more space to heat and cool. Conversely, homes have become more energy efficient over time (for example, through better insulation), and air conditioning and heating equipment has also become more efficient.
Electricity and natural gas use could also reflect utility prices (when rates are higher, people may choose to reduce their use) and the amount of electricity and natural gas that Americans use for other needs. Other considerations include whether new homes rely on electricity or gas for cooking, water heating, and other activities, and shifts towards the use of innovative electronic appliances over time.
Even with all these factors at work, many studies agree that rising temperatures can and will lead to increased use of electricity, as well as reduced use of heating fuels in winter. 2
The data for this indicator were provided by EIA, which maintains a large collection of information about how the United States produces and uses electricity and other forms of energy. EIA’s energy sales data can be found online at: www.eia.gov/electricity and www.eia.gov/naturalgas. EPA developed this indicator using two additional sources: population data from the U.S. Bureau of Economic Analysis and cooling and heating degree days from the National Oceanic and Atmospheric Administration.
1 EIA (U.S. Energy Information Administration). (2018). 2015 Residential Energy Consumption Survey. Retrieved December 1, 2019, from www.eia.gov/consumption/residential/index.cfm
2 Zamuda, C. D., Bilello, D. E., Carmack, J., Davis, X. J., Efroymson, R. A., Goff, K. M., Hong, T., Karimjee, A., Loughlin, D. H., Upchurch, S., & Voisin, N. (2023). Chapter 5: Energy supply, delivery, and demand. In USGCRP (U.S. Global Change Research Program), Fifth National Climate Assessment. https://doi.org/10.7930/NCA5.2023.CH5
3 EIA (U.S. Energy Information Administration). (2022). Frequently asked questions (FAQs): What is U.S. electricity generation by energy source? [Data derived from Electric Power Monthly and Electric Power Annual]. www.eia.gov/tools/faqs/faq.php?id=427&t=3
4 EIA (U.S. Energy Information Administration). (2022). Electricity retail sales to the residential sector, monthly. Retrieved January 13, 2023, from www.eia.gov/opendata
5 BEA (U.S. Bureau of Economic Analysis). (2022). Population (POPTHM). FRED, Federal Reserve Bank of St. Louis. Retrieved January 13, 2023, from https://fred.stlouisfed.org/series/POPTHM
6 NOAA (National Oceanic and Atmospheric Administration). (2022). National Centers for Environmental Information. Retrieved January 13, 2023, from www.ncei.noaa.gov
7 EIA (U.S. Energy Information Administration). (2022). U.S. natural gas residential consumption, monthly. Retrieved January 13, 2023, from www.eia.gov/opendata
9 EIA (U.S. Energy Information Administration). (2022). 2020 Residential Energy Consumption Survey. Retrieved January 13, 2023, from www.eia.gov/consumption/residential/index.php
To determine a "degree day," EPA compares the daily average outdoor temperature with a defined baseline temperature for indoor comfort (in this case, 65°F). For example, if the average temperature on a particular day is 78°F, then that day counts as 13 cooling degree days, as a building's interior would need to be cooled by 13°F to reach 65°F. If the average outdoor temperature is 34°F, then that day counts as 31 heating degree days, as a building's interior would need to be warmed by 31°F to reach 65°F.