With millions expected to be hospitalized during the COVID-19 pandemic, the U.S. health care system will be tested as it never has been before. In response, Congress has passed the Coronavirus Aid, Relief, and Economic Security (CARES) Act, which allocates $100 billion in assistance for hospitals and other health care providers. The Trump administration has signaled that it will use some of these funds to reimburse hospitals for treating uninsured COVID-19 patients at Medicare payment rates, which the CARES act also increased by 20% for COVID-19 treatment during the crisis. However, some have raised concerns that even these increased Medicare rates may not be sufficient.
Prior to the outbreak, national and state-level policymakers were already debating several proposals that would build on Medicare’s payment structure – including Medicare-for-All and various public option proposals – to establish standardized rates for hospitals, physicians, and other health care providers. While supporters point to potential coverage gains and reductions in national health spending, critics contend that bringing private insurer payments closer to Medicare rates could threaten providers’ financial viability. Once the U.S. overcomes the immediate public health emergency, attention will likely return to underlying questions regarding provider payments, as well as their impact on health expenditures and out-of-pocket costs. To inform both discussions, this issue brief reviews the findings of 19 recent studies comparing Medicare and private health insurance payment rates for hospital care and physician services.
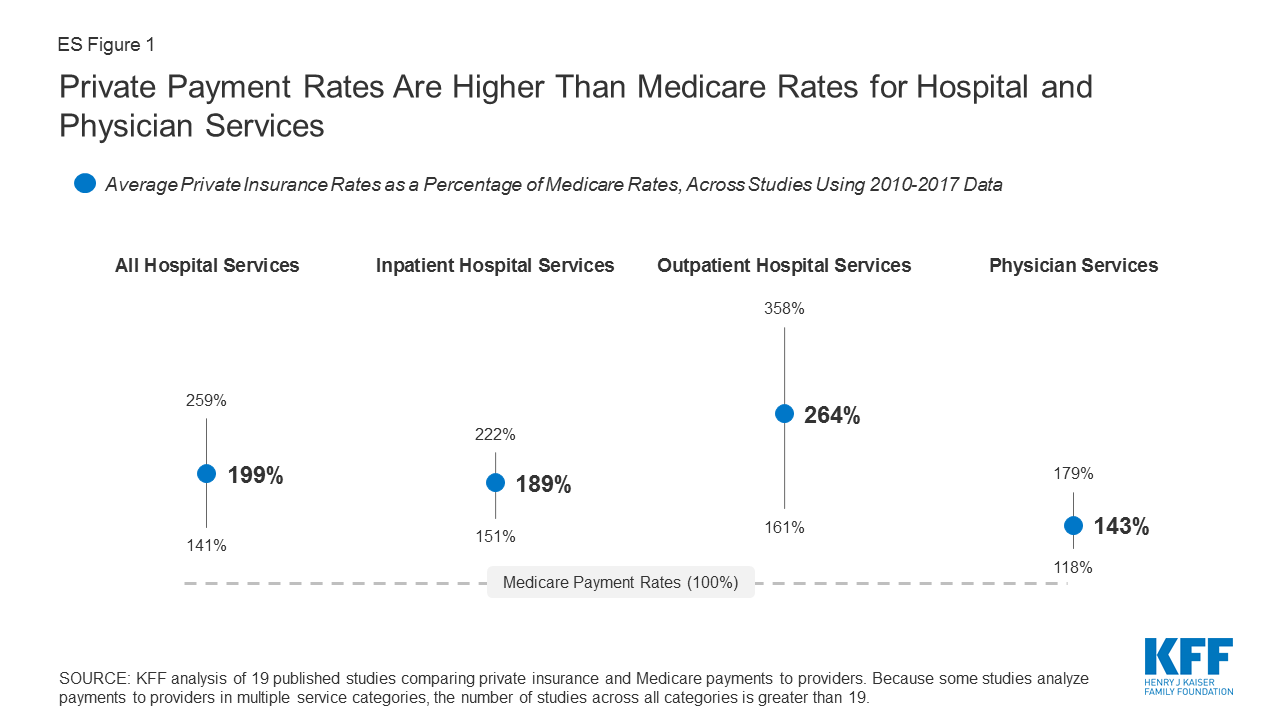
Across all studies, payments from private insurers are much higher than Medicare payments for both hospital and physician services, although the magnitude of the difference varies (ES Figure 1). Differences across studies may be due to a number of factors, including the representativeness of hospitals, physicians, and insurers used in the analysis, the data collection period, and the characteristics of the markets examined by each study, with some studies focusing on highly consolidated health care markets where providers have stronger negotiating leverage over insurers. (For study descriptions, see the Appendix Table).
Figure 1: Private Payment Rates Are Higher Than Medicare Rates for Hospital and Physician Services
Policymakers and analysts continue to debate whether relatively high payments from private payers are necessary to compensate for lower Medicare payments, and the extent to which providers could operate more efficiently to reduce costs. If provider payments were phased down closer to Medicare levels, providers would have stronger incentives to become more efficient, which could help make health coverage and care more affordable for patients and employers. However, even some relatively efficient providers appear to have been be losing money on Medicare patients over the past few years, prompting some leading public option and Medicare for all proposals to set hospital payments somewhat above current Medicare rates. While providers may be able to operate more efficiently than they do today, a transition period may be needed to give providers and payers time to adapt to lower payments, and to assess the potential implications for the quality and accessibility of care.
Health care spending in the United States is high and growing faster than the economy. In 2018, health expenditures accounted for 17.7% of the national gross domestic product (GDP), and are projected to grow to a fifth of the national GDP by 2027. 1 Several recent health reform proposals aim to reduce future spending on health care while also expanding coverage to the nearly 28 million Americans who remain uninsured, and providing a more affordable source of coverage for people who struggle to pay their premiums. 2 Some have argued that these goals can be achieved by aligning provider payments more closely with Medicare rates, whether in a public program, like Medicare-for-All, a national or state-based public option, or through state rate-setting initiatives. 3 , 4 , 5 , 6 , 7 , 8 9 , 10 , 11
Moreover, the global COVID-19 pandemic has heightened the urgency surrounding Medicare provider payments. In response to rising financial strain on hospitals during the crisis, Congress passed the Coronavirus Aid, Relief, and Economic Security (CARES) Act, which allocates $100 billion to assist hospitals and other providers. The Trump administration has signaled that it will use some of this funding to reimburse hospitals for treating uninsured COVID-19 patients at Medicare payment rates. Additionally, the CARES Act temporarily suspended 2% Medicare payment reductions that had been mandated under federal sequestration, and increased Medicare rates for COVID-19 hospitalizations by 20% during the legislation’s emergency period. 12 However, some have raised concerns that even these payments may not be sufficient, and that hospitals’ financial viability will become increasingly tenuous throughout the crisis. 13 Thus, these two debates over the adequacy of Medicare’s payment structure – to meet the needs of the pandemic response in the short term, and to serve as a basis for broader national or state-level health reform in the long term – merit a close look at how Medicare provider payments fit into the broader U.S. health insurance system.
Private insurers currently play a dominant role in the U.S. In 2018, private insurance accounted for more than 40% of expenditures on both hospital care and physician services. In comparison, Medicare accounted for about one quarter of these expenditures in the same year. 14 Consequently, adjustments to private insurers’ provider payment rates could have a profound impact on providers’ revenues, employers’ and privately insured Americans’ health spending, and national health spending overall.
Over the years, Medicare has adopted a number of payment systems to manage Medicare spending and encourage providers to operate more efficiently, which in turn has helped slow the growth in premiums and other costs for beneficiaries. For example, Medicare adopted its prospective payment system in 1983, which sets payment rates for hospitals in advance based on categories of hospital services known as diagnosis-related groups (DRGs). These payments are updated periodically to account for changes in providers’ operating costs, and are adjusted for factors such as direct and indirect expenses for graduate medical education (DGME and IME payments) and whether a disproportionate share of a hospitals’ patients are Medicare beneficiaries (DSH payments). 15 Since then, policymakers have made numerous modifications to this methodology, including a change adopted by the ACA in 2010 that adjusts annual updates in Medicare payments to hospitals for assumed productivity increases, resulting in lower payment rates and significant savings for Medicare. 16 Medicare has also adopted a number of specific payment systems for virtually every type of health care provider, building in incentives for providers to become more financially efficient.
By contrast, private insurers’ payment rates are typically determined through negotiations with providers, and so vary depending on market conditions, such as the bargaining power of individual providers relative to insurers in a community. Accordingly, Medicare has been able to limit growth in expenditures per enrollee more effectively than private insurers at several points in recent decades. 17 , 18
Proponents of proposals to broaden the use of Medicare rates, or to use a multiplier of Medicare rates as a benchmark, say that such an approach would help make expanding coverage more affordable and reduce excess costs in the U.S. health care system. In an effort to broaden coverage through an affordable public option, Washington State recently adopted a proposal to establish a public option that would set payments at 160% of Medicare rates, and other states – most notably Colorado, which is also considering a public option with payments set at a percentage of Medicare rates – may soon follow Washington’s lead. 19 , 20 Rate-setting programs in Maryland and Vermont do not tie provider payments to an explicit percentage of Medicare rates, but rather their “all-payer” programs allow their respective state governments to set payment rates for hospitals (in Maryland) and for providers in participating Accountable Care Organizations (in Vermont), and have achieved savings on state-level health expenditures by some measures. 21
However, some have raised concerns that Medicare payments are not keeping pace with provider costs. For example, following the enactment of productivity adjustments to hospital payments in the ACA of 2010, and further reductions under the Budget Control Act of 2011, the Department of Health and Human Services (HHS) actuaries warned that the reductions in payments could eventually make it difficult for hospitals to operate profitably – a concern amplified by the hospital industry. 22 , 23 Similar red flags were raised with respect to the formula set in law for physician payments, known as the Sustainable Growth Rate, or SGR, which Congress modified repeatedly to avoid annual reductions in Medicare payments. The SGR was ultimately repealed, but left in its wake some concern that future payments would not keep pace with practice costs. 24 Citing these issues, some have argued that the financial strain imposed by lower payment rates may render many hospitals and physician practices unsustainable, jeopardizing patient care. 25 , 26 Ultimately, the capacity of providers to operate successfully would likely depend on the magnitude of the gap between private and Medicare rates, and other factors such as how effectively and quickly they are able to respond to reduced payments by improving their efficiency.
To bring together available evidence on these issues, this brief first reviews recent studies comparing private insurers’ and Medicare’s provider payment rates, focusing on studies that examine hospital services and physician services over the period from 2010 to 2017. We summarize the results of studies examining payments for hospital and physician services, and explore methodological factors that may explain variation in estimates across studies. Finally, we review available literature comparing hospitals’ and physician practices’ costs to Medicare payments, and discuss the potential implications of bringing provider payments closer to Medicare rates.
This brief reviews findings from studies that compare Medicare and private insurance rates for hospital and physician services. We include studies with data from 2010 onward to reflect changes to Medicare provider payment rates established by the Affordable Care Act, and subsequent policy adjustments over the past decade. We identified 19 relevant studies through keyword searches of academic search engines, as well as the websites of governmental, research, and policy organizations that publish work related to health care and health economics. These studies analyze data reported by the Centers for Medicare and Medicaid Services, private insurers, hospitals, and physician practices.
Of these 19 studies, 14 addressed payments to hospitals, eight of which addressed payments for inpatient hospital services, five addressed payments for outpatient services, and seven reported relative payment rates for both types of hospital services combined, with some overlap across studies. Eight studies addressed payment rates for physician services. The full search methodology is described in the Methods section.
To compare findings across multiple studies, we focus on private insurance payments as a percentage of corresponding Medicare payment rates reported by each study. We calculate the average across all studies, by provider category, such as inpatient hospital care. Due to the relatively small number of studies available, our calculation of an overall average gives each study equal weight, recognizing that each varies substantially in methods, data sources, the number and representativeness of providers and payers examined, and geographic focus (e.g., some studies are based on national data while others are state-specific).
For studies that report private-to-Medicare payment rate ratios for multiple years, we calculate an average across years to create one estimate used for the cross-study average. These included studies by the American Hospital Association (AHA), the Colorado Department of Health Care Policy and Financing (DHCPF), White and Whaley’s 2019 study, and two studies by Selden and colleagues published in 2015 and 2020, respectively. This approach prevents disproportionate weighting of results from studies that reported rates for multiple years. Moreover, we do not weight studies differently based on factors such as their geographic scope; studies that examined nationwide provider markets are given equal weight to those that focused on rates for provider in selected states or smaller markets, which may skew overall averages toward the prevailing private-to-Medicare payment ratios in these particular markets. (See the Appendix Table for methodological details for each study).
Of the eleven studies that examined differences between Medicare and private insurance rates for hospitals, seven did not distinguish between inpatient and outpatient hospital services. Across these seven studies, private insurance rates for inpatient and outpatient hospital services averaged 199% of Medicare rates, but the results varied widely, ranging from 141% (Wallace and Song, using nationwide data) to 259% (Ge and Anderson, using data specific to hospitals in Florida, which the authors note are disproportionately private, for-profit hospitals) of Medicare levels (Figure 2). However, the variation within studies was often substantially wider, as the ratio of private-to-Medicare rates often differed dramatically across markets, services, and even individual hospitals. The greatest variation was observed in Ge and Anderson’s study of Florida hospitals, which found private insurance payments ranging from 170% to over 1400% across Hospital Referral Regions (HRRs) in the state. White and Whaley’s multi-state analysis also found notably large variation at the level of individual hospitals, ranging from approximately 150% to 450% of Medicare rates for the composite of inpatient and outpatient services. These findings suggest that, even within a given health care market, some individual hospitals may be outliers in that they can command extremely high private reimbursements.
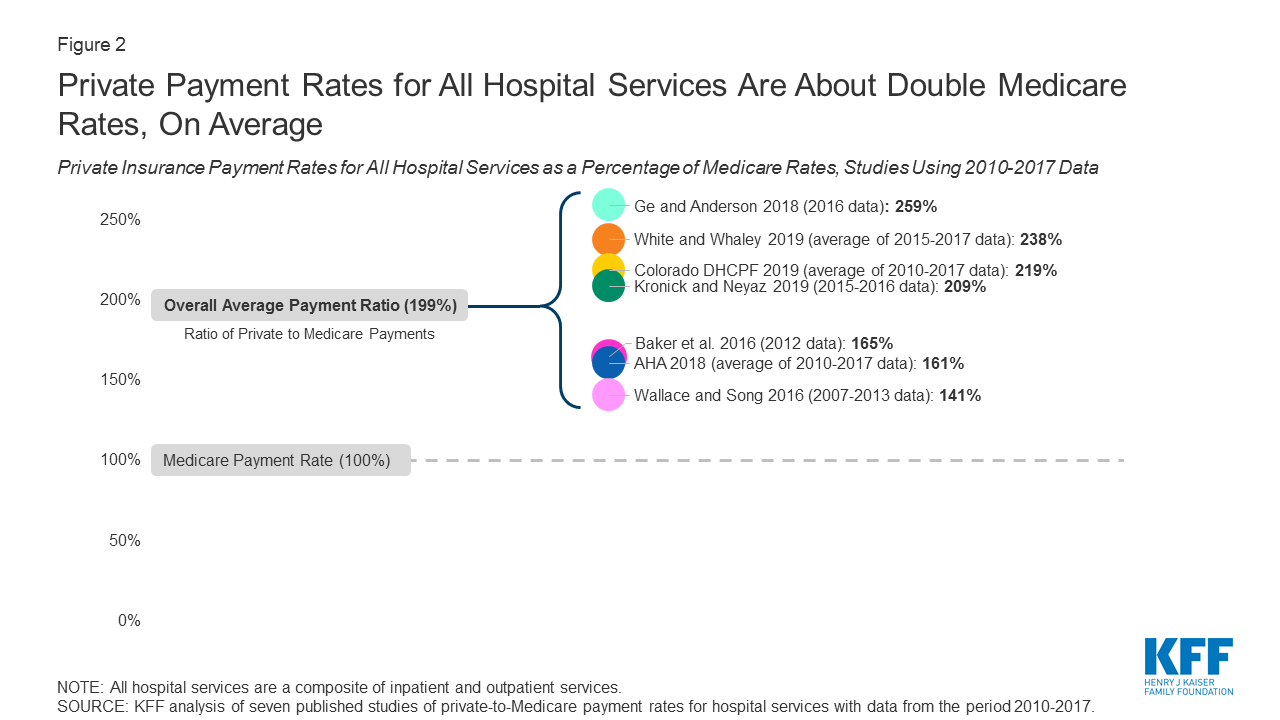
Figure 2: Private Payment Rates for All Hospital Services Are About Double Medicare Rates, On Average
Eight studies compared private insurance and Medicare payment rates for inpatient hospital services. Private insurance payment rates for inpatient hospital services averaged 189% of Medicare rates across studies, ranging from 150% (White and colleagues, 2013 analysis) to 222% (Cooper and colleagues, 2018) (Figure 3). Within studies, the greatest variation was seen in White and Whaley’s analysis, which reported private-to-Medicare payment ratios for inpatient hospital services ranging from 34% to 581% across individual hospital systems. This range was comparable to the variation seen across specific inpatient services in Cooper and colleagues’ study, which ranged from 161% for vaginal deliveries to 400% for lower extremity MRI, as well as the range of 84% to 484% across markets reported by Ginsburg.
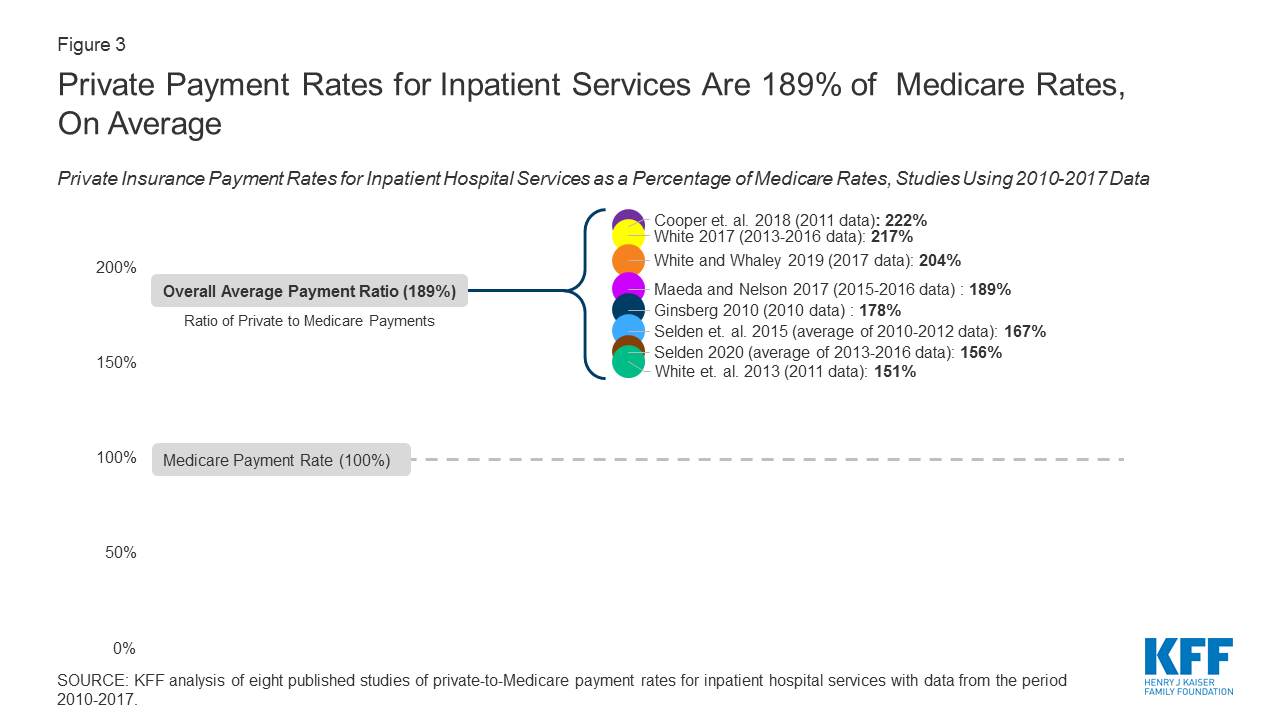
Figure 3: Private Payment Rates for Inpatient Services Are 189% of Medicare Rates, On Average
As with the analysis combining inpatient and outpatient services, we averaged estimates for each year in studies that present multiple years of results based on the same methodology and data source. In keeping with this approach, we also averaged results from the 2015 and 2020 studies published by Selden and colleagues, as both studies intentionally used the same data source and methodology.
There is notably less variation in the ratio of private-to-Medicare payments among studies of inpatient hospital payments than studies that examine rates for all hospital services combined, as may be expected since the range of services represented is narrower.
Five of the reviewed studies examined the difference between private insurance rates and Medicare rates for outpatient hospital services. Across these studies, the ratio of private-to-Medicare payment rates fluctuated more than they did for combined hospital services or for inpatient hospital services. Results ranged from a low of 150% of Medicare rates in the final year of Selden’s 2020 study of hospitals nationwide to a high of 358% in White’s 2017 study of Indiana hospitals (Figure 4), averaging 264% of Medicare rates overall. Within studies, the greatest variation was seen in White and Whaley’s analysis, in which private-to-Medicare payment ratios for outpatient services ranged from 50% to as high as 2958%. Notably, Ginsburg also reported a wide range across major metropolitan markets from 158% to 718% of Medicare rates, and Cooper reported a range of 171% to 496% across specific outpatient services.
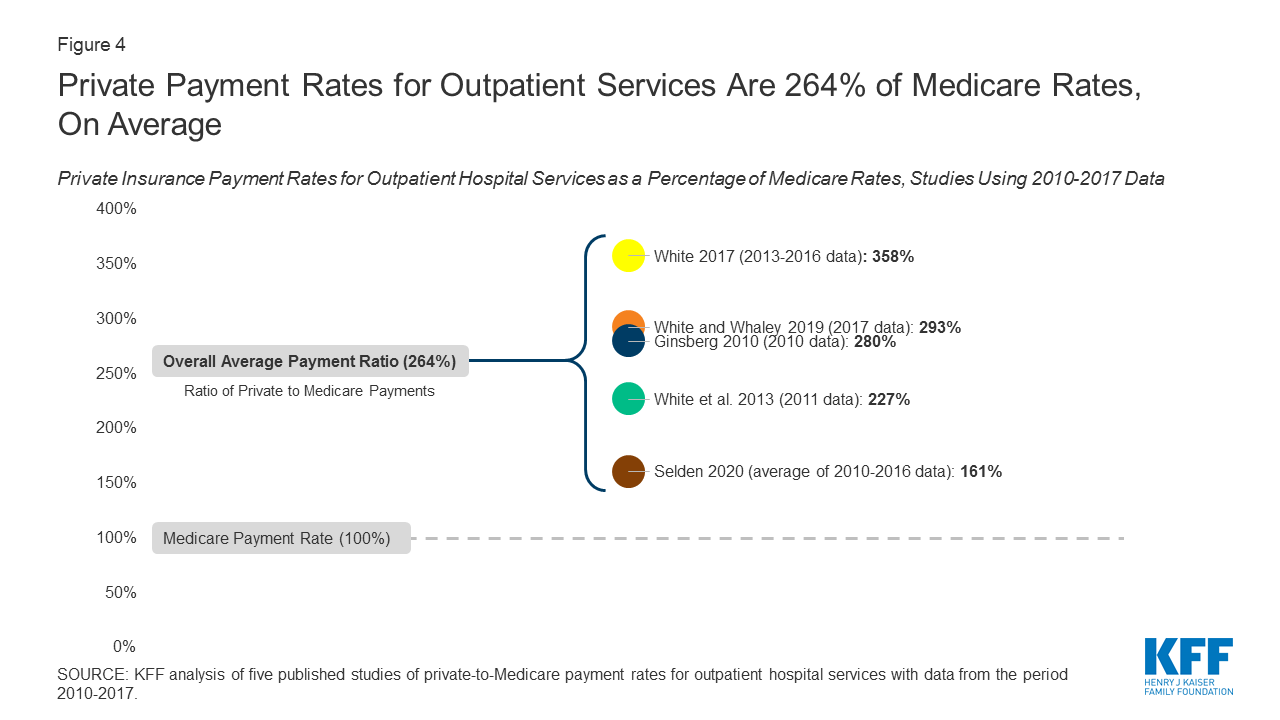
Figure 4: Private Payment Rates for Outpatient Services Are 264% of Medicare Rates, On Average
The relatively high private-to-Medicare payment ratio reported by White’s 2017 study (358%) is partly attributable to the fact that the analysis was limited to hospitals in Indiana, which, according to White and Whaley in their 2019 multi-state follow-up study, has exceptionally high degree of hospital consolidation compared to other state hospital markets. If this one study is excluded, the overall average for outpatient hospital services drops from 264% to 240% of Medicare payment rates.
Several factors may contribute to variations in estimates across studies, including: the representativeness of hospitals and private insurers; the relative market power of hospitals and insurers in the markets included in the analysis; the types of hospital services examined; the components of private insurance and Medicare payments used to calculate their respective payment rates; and the treatment of out-of-network payments. These factors are described in greater detail below and in the Appendix Table.
Eight studies compared private insurance and Medicare payment rates for physician services. Private insurance rates averaged 143% of Medicare rates overall, ranging from 118% (Ginsburg, 2010) to 179% (Song, 2019) of Medicare levels across studies (Figure 5). Estimates from each year of the MedPAC analysis were averaged to calculate the overall average across the studies. Within studies, the greatest variation was seen in Pelech’s analysis, which reported a range of private-to-Medicare payment ratios for specific physician services from less than 80% for established patient office visits to over 400% for the physician service component of brain MRI. Ginsburg also reported a significant range across major metropolitan markets, ranging from 82% to 251%.
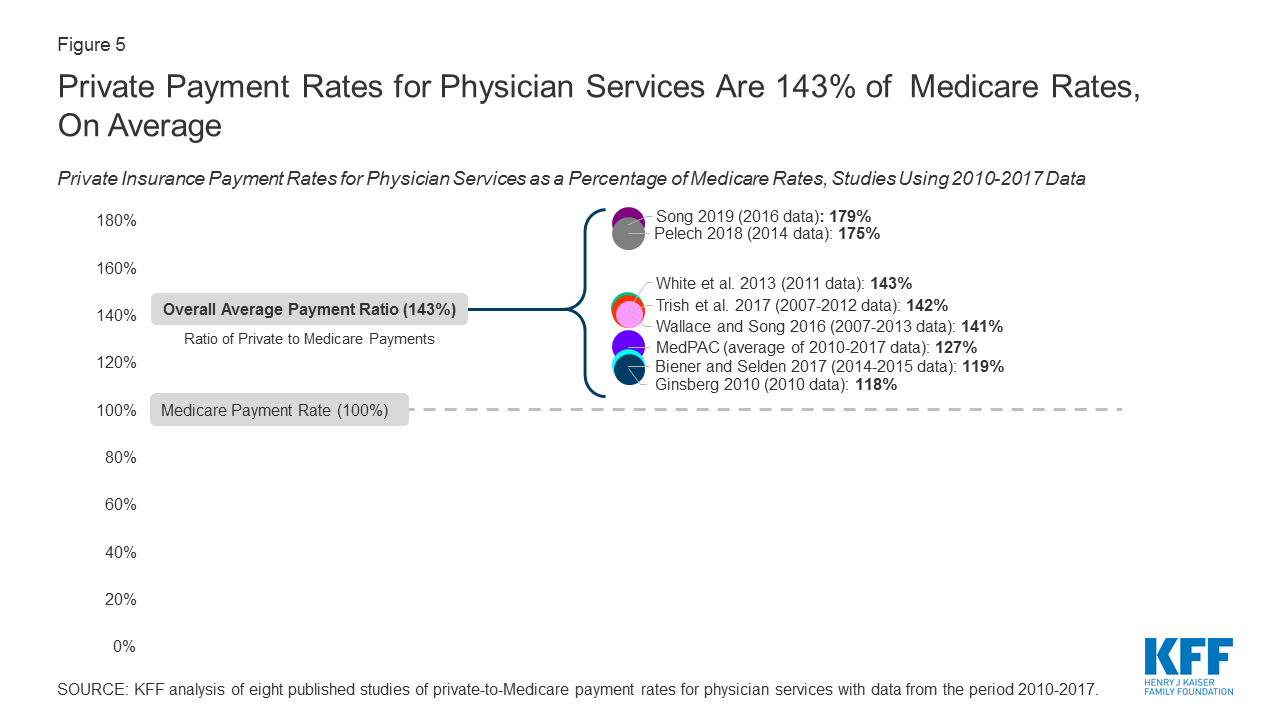
Figure 5: Private Payment Rates for Physician Services Are 143% of Medicare Rates, On Average
Across all studies, private insurance rates for physician services are substantially closer to Medicare levels than private insurance rates for hospital services, which suggests that physician groups generally have less negotiating leverage relative to private insurers than hospital groups. Nonetheless, the reviewed studies still demonstrate pronounced variation overall.
Much of the variation in reported physician payment rates may be explained by methodological differences, several of which echo those seen among the reviewed studies of hospital payments. The most significant of these include the relative market power of physicians and insurers in the markets being examined, the types of physician services used for the comparison, the components of private insurance and Medicare payments included in the calculation of their respective payment rates, and the authors’ treatment of out-of-network payments.
To assess the adequacy of Medicare’s hospital payment rates, MedPAC regularly compares the program’s payments to hospitals’ care delivery costs. Their findings show that, across all hospitals over the period from 2010 to 2018, costs for the treatment of Medicare beneficiaries have exceeded Medicare payments, resulting in negative and declining aggregate Medicare margins (Figure 6). 87 Both MedPAC and American Hospital Association analyses show aggregate all-payer hospital margins have remained positive between 6% and 8% during the same period due to the contribution of private payers. 88 , 89 Some
hospital industry groups and researchers see these data as evidence that higher payment rates from private insurers are necessary to offset the financial strain of Medicare’s relatively low rates. 90
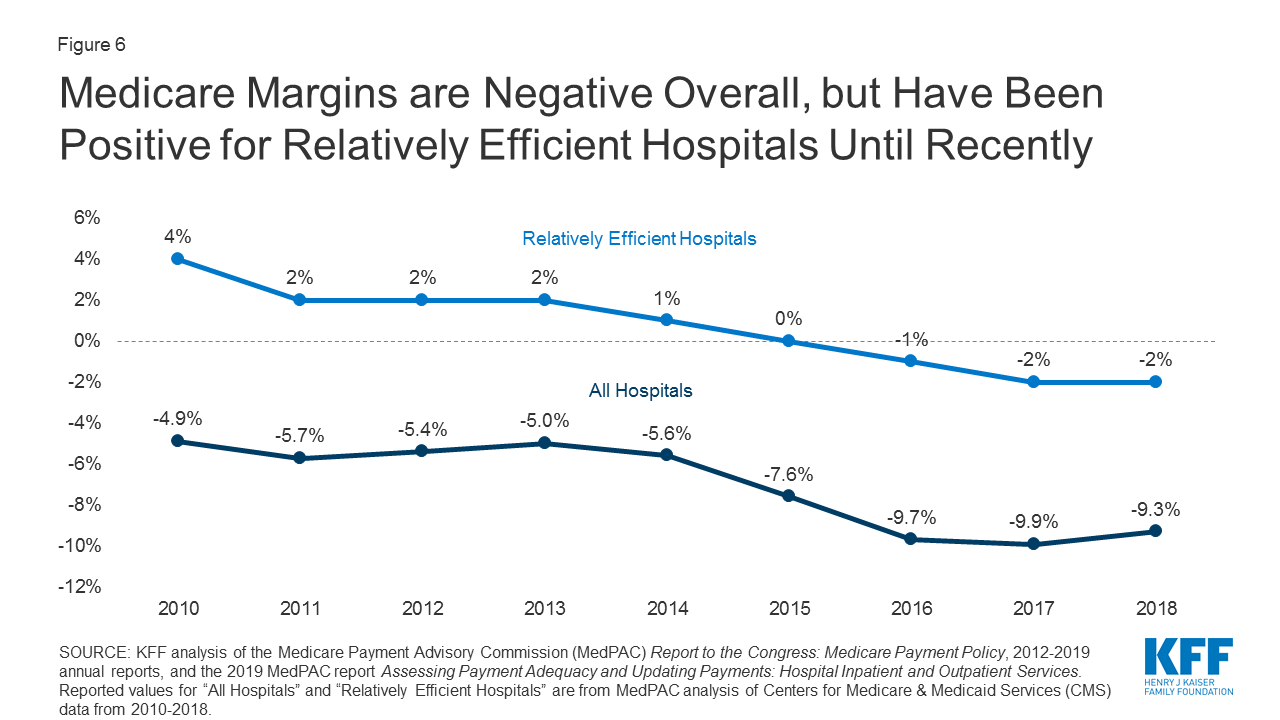
Figure 6: Medicare Margins are Negative Overall, but Have Been Positive for Relatively Efficient Hospitals Until Recently
However, MedPAC and other researchers have argued that hospitals could do more to contain their costs. 91 , 92 , 93 , 94 , 95 , 96 , 97 , 98 , 99 , 100 , 101 , 102 , 103 They point to the nationwide trend of growing hospital consolidation through mergers and the acquisition of physician practices over the past several decades, which has given hospitals increasingly strong market power relative to insurers. 104 105 , 106 , 107 Consequently, these researchers argue that outsize market power allows hospitals to negotiate increasingly high payment rates from private insurers unrelated to how Medicare’s payments compare to costs, easing the financial pressure on these hospitals to cut costs or improve their efficiency. In this alternative explanation, providers’ costs may grow faster than Medicare payments, and financial losses on Medicare patients steepen over time. 108 , 109 , 110 , 111 , 112 , 113 , 114 In other words, they suggest that hospitals do not shift costs to private payers to make up for Medicare losses, but rather charge private payers what the market will bear.
Medicare payments have historically been adequate for many financially efficient providers, defined by MedPAC has separately examined Medicare margins across hospitals it designates as “relatively efficient” (with costs below a defined threshold, among other metrics), finding a consistently positive overall Medicare margin for this subset of hospitals until about 2015. However, even this margin has also been slightly negative since 2016. MedPAC has recommended that previously planned Medicare payment updates should be increased to correct for this, though maintains the view that holding Medicare payments close to efficient hospitals’ costs is desirable because it places pressure on hospitals to improve their efficiency. 115
Physician groups have also pointed out discrepancies between their practice costs and Medicare payments. 116 , 117 Because there is no required national cost reporting for physician practices as there is for hospitals, CMS and researchers rely on small, sporadic surveys of physicians and practice managers. These include the Physician Practice Information Survey (PPIS) conducted by the American Medical Association in 2007 and 2008. PPIS data are still used in the calculation of the Medicare Economic Index (MEI), which measures inflation in the prices of goods and services needed to operate a physician practice. CMS uses the MEI as a major factor in the determination of annual payment rate updates to the Medicare Physician Fee Schedule. 118 For this reason, MedPAC also tracks changes in the MEI relative to changes in Medicare provider payments as an indirect measure of payment adequacy.
MedPAC analyses from 2010 to 2017 found that payment updates to Medicare’s Physician Fee Schedule increased cumulatively by 11% over that period, while the MEI increased cumulatively by 33%. 119 To the extent that the MEI is a reliable indicator of the cost of providing care, this suggests Medicare’s payment updates may not have kept up with growing costs for some physicians. However, there has long been concern that the MEI does not accurately represent modern physician practices’ costs, given limitations in the original PPIS survey data and the fact that they are now over a decade old. 120 , 121 , 122 , 123 , 124 125 Physicians and researchers have called for CMS to update its methodology for estimating practice costs. 126 , 127 MedPAC has specifically recommended that CMS use data from a cohort of “relatively efficient” practices as it already does for hospitals, arguing that this would allow for a more accurate – and, likely, more favorable – determination of Medicare payment adequacy. 128 MedPAC has also proposed a number of Medicare payment adjustments that would boost payment rates for primary care physicians and increase the relative valuation of routine evaluation and management services, which would likely improve the adequacy of Medicare payments for many primary care practices. 129 , 130 However, as for hospitals, MedPAC maintains that holding Medicare payment rates close to practice costs incentivizes physician practices to become more efficient. 131
Based on the reviewed studies comparing Medicare and private insurance rates for hospital and physician services, this brief finds that private insurance payments are consistently greater, averaging 199% of Medicare rates for hospital services overall, 189% of Medicare rates for inpatient hospital services, 264% of Medicare rates for outpatient hospital services, and 143% of Medicare rates for physician services. However, there is wide variation across studies due to different market dynamics in different parts of the country and for different types of medical care as well as differences in the studies’ methodology and data sources. Private payment rates for hospitals averaged as high as 358% of Medicare rates in a study of a highly concentrated state-level hospital market, and as low as 151% of Medicare rates in a study of a market with one dominant private insurer, with individual studies demonstrating even greater variation across markets, services, and individual hospitals.
Some providers have argued that Medicare payment rates are too low to cover the reasonable cost of care, and that these shortfalls lead them to raise prices for private payers. However, much of the literature suggests that providers negotiate prices with private insurers irrespective of Medicare rates, and that providers with substantial market power are best positioned to command high prices, allowing them to evade financial pressure to become more efficient.
Moreover, the costs of operating a hospital or physician practice are not fixed, and fluctuate depending on factors such as available revenues. Currently, many hospitals are facing new costs associated with the infrastructure and resources needed to treat COVID-19 patients, which may require transitional funding increases such as those implemented by the CARES Act. However, once the pandemic has passed, an increased role for Medicare reimbursements could lead many hospitals and other health care providers to phase down their operating costs accordingly. Thus, predictions of widespread provider closures under Medicare-based reform proposals may be overstated, particularly for proposals that set rates higher than current Medicare rates. If private insurers’ payments were brought closer to Medicare levels, even providers whose market power has thus far protected them from financial pressure would have a strong incentive to constrain their costs, which may lead to substantial reductions in national health spending on hospital and physician services.
Proposals that would extend Medicare rates, or a multiplier of Medicare rates, to a broader population –such as Medicare-for-All and public option proposals – could also contribute to lower premiums, deductibles, and point-of-care costs for patients. Lower provider payments could lead to lower per capita spending, leading in turn to lower out-of-pocket costs. Employers could also realize savings under proposals that extend Medicare rates to private insurers, which could allow them to redirect some funds currently spent on employee health coverage, including toward wages. Particularly during the current pandemic, it is worth noting that many privately insured patients hospitalized with COVID-19 would have faced lower out-of-pocket costs if their treatment had been reimbursed at Medicare rates.
However, the fact that even some relatively efficient providers are now losing money on Medicare suggests that the capacity of providers to become more efficient will vary substantially. To address these concerns, some states are moving forward with proposals to establish rates that are higher than Medicare rates but lower than rates currently paid by private insurers, and the current Medicare program has increased payments for inpatient COVID-19 care to better meet the needs of the pandemic response. Even after overcoming the current crisis, federal and state policymakers will continue facing difficult choices as they seek to rein in health spending while safeguarding the accessibility and quality of care.
| Methods |
| This literature review summarizes findings from 19 studies that compare payment rates paid by private insurers and Medicare for hospital care and physician services, using data pertaining to the period from 2010 to the present. Studies that only addressed other types of providers such as home health services and long-term care facilities were excluded. The studies reviewed in this brief are limited to those that compare private insurance rates with rates under traditional fee-for-service Medicare; studies that addressed only payments by Medicare Advantage plans were excluded. |
To collect relevant studies that met these criteria, the authors conducted keyword searches of PubMed, Google Scholar, EconPapers, and other academic search engines, as well as the websites of governmental, research, and policy organizations that publish work related to health care and health economics. Additional studies found in the reference lists that resulted from the initial search were also included. These included a larger body of supporting research, which is cited throughout this brief to provide additional historical and scientific context to the results presented.
Nineteen studies comparing private and Medicare provider payment rates were identified. Of these, 14 studies addressed payments to hospitals, with eight addressing payments for inpatient services, five addressing payments for outpatient services, and seven reporting relative payment rates for both types of hospital services combined, with some overlap among studies. Eight of the studies identified addressed payment rates for physician services.
This work was supported in part by Arnold Ventures. We value our funders. KFF maintains full editorial control over all of its policy analysis, polling, and journalism activities.
Eric John Lopez is a KFF-UCSF Health Policy Fellow. Tricia Neuman and Larry Levitt are with the Kaiser Family Foundation. Gretchen Jacobson was at the Kaiser Family Foundation when this report was written.